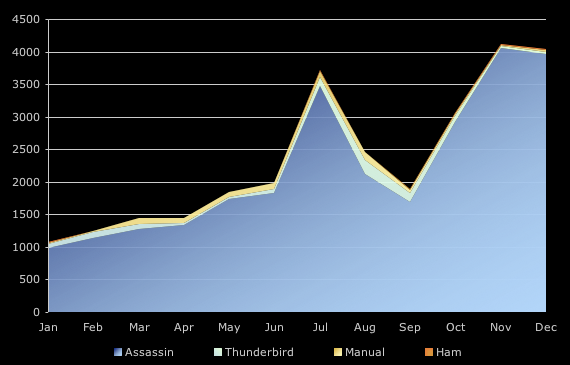
Counts of all mail, stacked linearly (monthly)
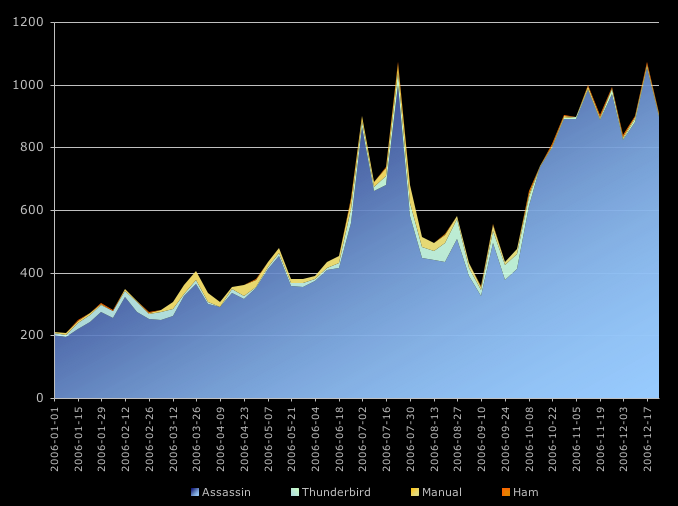
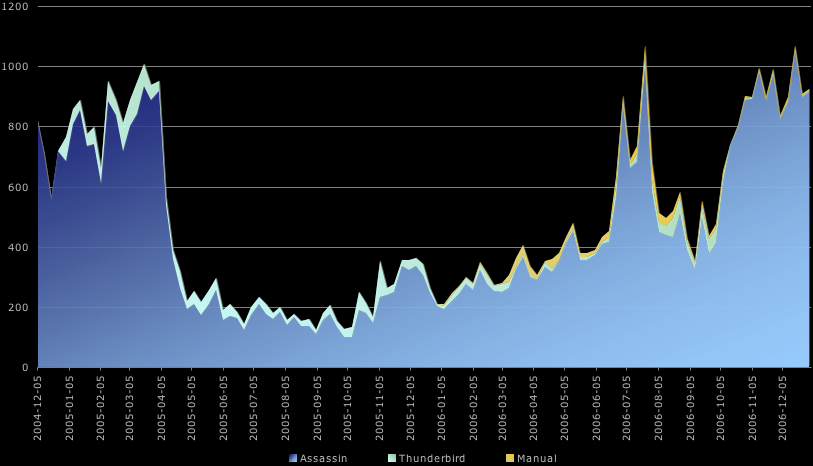
Counts of all mail, stacked linearly (weekly)
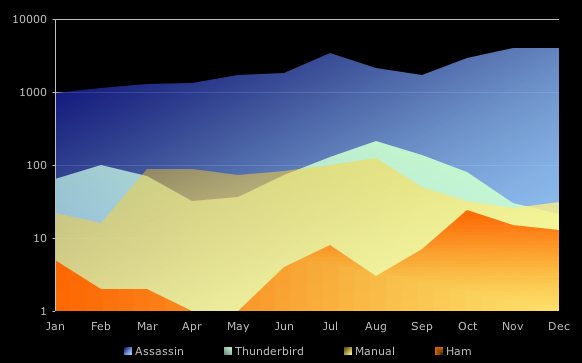
Counts of all mail, overlaid logarithmically (monthly)
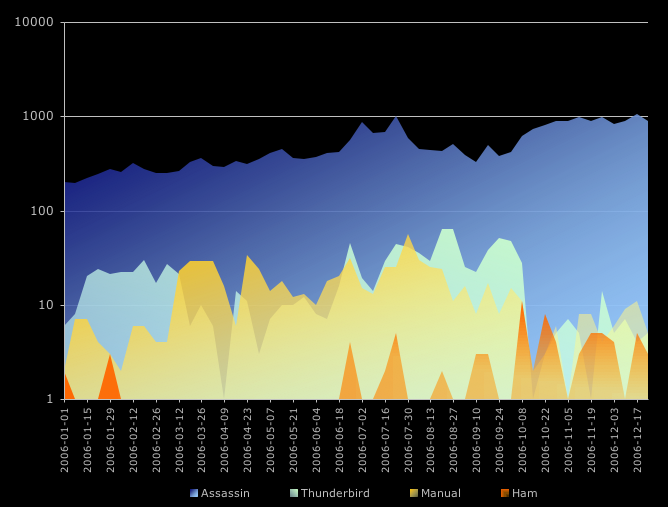
Counts of all mail, overlaid logarithmically (weekly)
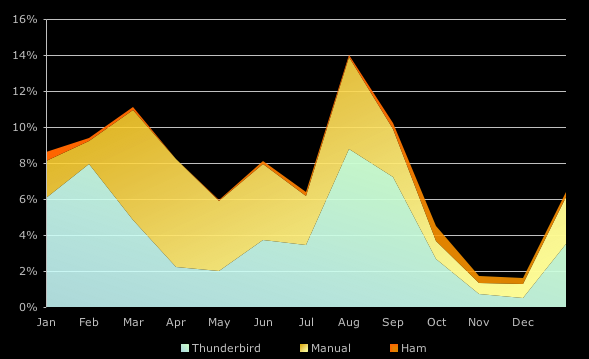
SpamAssassin failures, absolutely and stacked (monthly)
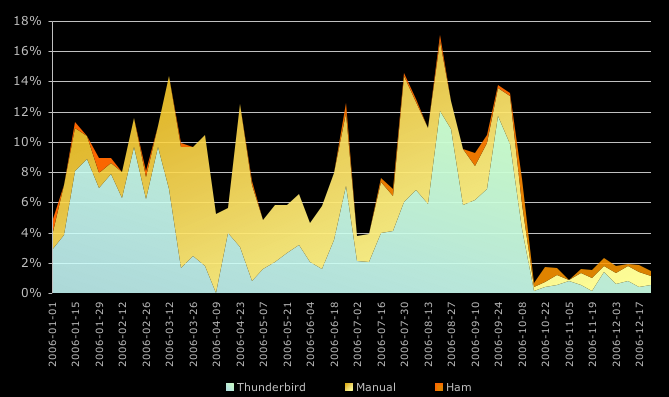
SpamAssassin failures, absolutely and stacked (weekly)
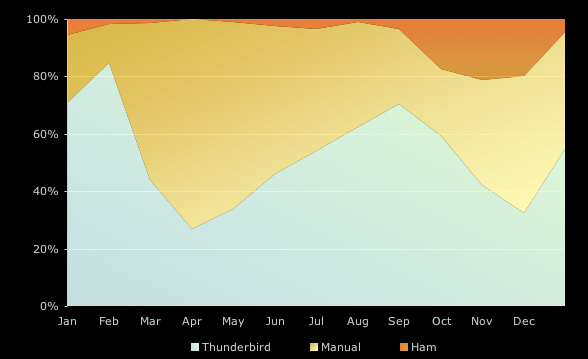
SpamAssassin failures, relatively (monthly)
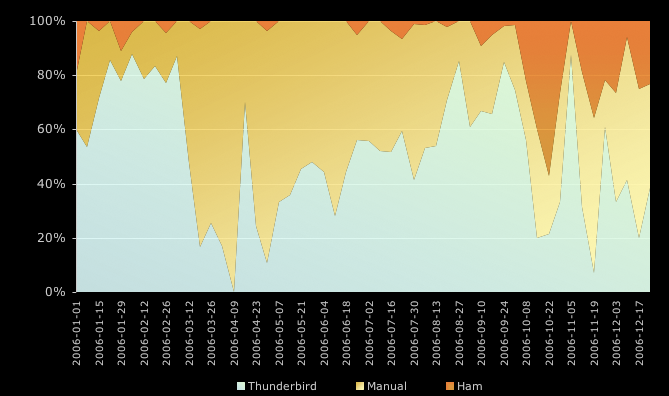
SpamAssassin failures, relatively (weekly)
Cumulative spam counts, linearly (weekly)
Since IMAP delivery includes the timestamp in the filename, I just used some shell scripting to generate numbers. I keep originals of spam and copies of ham in per-year directories. The general idea is like this:
% cd assassin/2006
% ls -1| cut -d'.' -f1|sort|xargs -I% -n 1 date -d 'Jan 1 1970 % sec GMT' | cut -d' ' -f2 |uniq -c
    979 Jan
   1132 Feb
   ...
I lack a UNIX graphing tool. Anybody who can point me to one wins a cookie; I pushed the data into Excel, punched in some quick formulas, copied some of last year's graphs, and took screenshots since the graphic export function is crippled. Et voilà, graphs.